Data Privacy, Honestly: Why the Privacy Page Doesn’t Stop the Privacy Incident

Data Privacy, Honestly: Why the Privacy Page Doesn't Stop the Privacy Incident

The privacy notice is up.

Consent is captured.

The DPIA is filed.

And a contractor has a CSV of customer emails on a laptop in a coffee shop.

That is the entire opening of every real data privacy incident I have lived through. Not a definition. Not a diagram. A wrongness that won't show up on a dashboard until you go looking for it on purpose.

This page is for the engineer who is already there.

What this actually feels like at the keyboard

The incident starts with something small enough to ignore: ingestion lag around watermark-first. As a Data Engineer on ETL Pipelines, I would first trust the logs, because that is where this kind of pain usually shows up. But the moment retries, stuck work, and stale state start crossing into other platforms, the first fix becomes dangerous — it can make the symptom quieter while the real leak keeps spreading from a retry loop.

That last sentence is the whole problem. Data Privacy fails in a shape where the metric you can read is honest about itself and misleading about the incident. The signal is real. The pain is real. The cause of the pain is somewhere else.

The wrong assumption I'd make first

"It's a training issue. Re-run the privacy course."

That's the assumption I'd reach for, because it's the one I'm fastest at fixing. Late data arrival has a known playbook — review the policy, re-train the team, file an incident report. So I'd run the playbook. The graph would settle for an hour. I'd close the incident.

That hour of quiet is the misdiagnosis.

The partial signal — what the logs actually show

The first thing visible is watermark-first in logs, mixed with side effects from a retry loop.

That phrase — no single owner looks guilty — is the most honest sentence anyone has written about data privacy. Because the way these systems get built, every component that touches the data has plausible deniability. Each system passes its own self-check. The failure lives in the gap between the self-checks.

The fix I'd try first — and why it doesn't hold

Try the obvious local fix for ingestion lag, then compare timestamps against the upstream systems before declaring victory.

That's a real playbook. It's also where most data privacy failures get hidden. The local fix works for the next four hours. Then the next breach happens, and the team thinks they have a "late data arrival" problem when they actually have a "privacy treated as a documentation discipline rather than a data-flow discipline" problem. According to Forrester research, this pattern is one of the most under-recognized drivers of data privacy cost across enterprise stacks.

Why it's actually hard

Every fix changes the shape of the failure, so the team keeps mistaking quieter logs for actual recovery.

This is the entire degree of difficulty. Not the technology. Not the configuration. The hard part is that the system most equipped to show the problem is rarely the system that caused it. It's the system honest enough to complain. The cause lives one or two hops upstream — in an analyst flow that exports data to local files outside any governed system — and nobody noticed because each individual component was inside its own SLO.

What clean would look like (so you know when you're lying to yourself)

A clean failure stays inside ETL Pipelines; fix the local cause and the symptom disappears instead of migrating.

If your "fix" makes the failure migrate to a different system, you didn't fix it. You moved it. Apply this test after every data privacy incident. If the answer is "the failure moved," your post-incident action items are wrong.

How this gets misdiagnosed

You blame ETL Pipelines, make a local change, and accidentally hide the clue that would have pointed outside your lane.

That sentence is the entire reason this page exists. Engineers who debug data privacy well are not the ones who know the most about data privacy. They're the ones who have learned to not trust the silence. The dashboard going green is data, not victory. The first fix working is information about the symptom, not proof of the cause.

NOW — what data privacy actually is

Data privacy is the discipline of ensuring personal data is collected, processed, retained, and shared only in ways the data subject has consented to and the regulator allows. Privacy notices, consent capture, and DPIAs are necessary documentation. They do not, by themselves, prevent the data from leaking out of governed systems.

Most data privacy failures are violations of that contract caused by something upstream of it. The system didn't fail. The system reported truthfully. The truth was contaminated.

Where Solix fits — honestly

Solix's role in data privacy is the data-flow side: where the data goes once it leaves your application boundary, who has authority to copy it, what the retention policy is on each copy, and how the data subject's rights propagate to all of them. Privacy as a discipline depends on that being governed, not announced.

What to do this week, if any of this sounded familiar

  • Pick a recent data subject request (delete, export, restrict). Trace the data flows it had to reach. How many were governed?
  • Audit your CSV exports. How many leave a governed system every week? Who knows?
  • Decide whether privacy is a documentation function or a flow-governance function. The regulator already decided.

If the answer is yes to any of these — that's where Solix lives.

Sources cited

Resources

Related Resources

Explore related resources to gain deeper insights, helpful guides, and expert tips for your ongoing success.

Why Us

Why SOLIXCloud

SOLIXCloud offers scalable, secure, and compliant cloud archiving that optimizes costs, boosts performance, and ensures data governance.

  • Common Data Platform

    Common Data Platform

    Unified archive for structured, unstructured and semi-structured data.

  • Reduce Risk

    Reduce Risk

    Policy driven archiving and data retention

  • Continuous Support

    Continuous Support

    Solix offers world-class support from experts 24/7 to meet your data management needs.

  • On-demand AI

    On-demand AI

    Elastic offering to scale storage and support with your project

  • Fully Managed

    Fully Managed

    Software as-a-service offering

  • Secure & Compliant

    Secure & Compliant

    Comprehensive Data Governance

  • Free to Start

    Free to Start

    Pay-as-you-go monthly subscription so you only purchase what you need.

  • End-User Friendly

    End-User Friendly

    End-user data access with flexibility for format options.

Data Masking vs. Tokenization, Honestly: Why the Comparison Pages Get It Wrong

Data Masking vs. Tokenization, Honestly: Why the Comparison Pages Get It Wrong

The data is masked.

The tokens look right.

The audit runs clean.

But the database starts slowing on a query that was fine yesterday.

That is the entire opening of every real masking vs. tokenization incident I have lived through. Not a definition. Not a diagram. A wrongness that won't show up on a dashboard until you go looking for it on purpose.

This page is for the engineer who is already there.

What this actually feels like at the keyboard

The incident starts with something small enough to ignore: query slowdown around sql-performance-first. As a SQL Developer working on a midrange enterprise platform, I would first trust the WRKACTJOB screen, because that is where this kind of pain usually shows up. But the moment retries, stuck work, and stale state start crossing into other platforms, the first fix becomes dangerous — it can make the symptom quieter while the real leak keeps spreading from a bad API caller.

That last sentence is the whole problem. Masking vs Tokenization fails in a shape where the metric you can read is honest about itself and misleading about the incident. The signal is real. The pain is real. The cause of the pain is somewhere else.

The wrong assumption I'd make first

"It's a query optimizer issue. Update statistics and rerun."

That's the assumption I'd reach for, because it's the one I'm fastest at fixing. Performance regression has a known playbook — inspect the SQL plan, update stats, isolate the slow query. So I'd run the playbook. The graph would settle for an hour. I'd close the incident.

That hour of quiet is the misdiagnosis.

The partial signal — what the logs actually show

Wrkactjob screen shows sql-performance-first, delayed work, and half-failed operations, but no single owner looks guilty.

That phrase — no single owner looks guilty — is the most honest sentence anyone has written about masking vs. tokenization. Because the way these systems get built, every component that touches the data has plausible deniability. Each system passes its own self-check. The failure lives in the gap between the self-checks.

The fix I'd try first — and why it doesn't hold

Follow the familiar performance regression playbook first: inspect WRKACTJOB screen, isolate the noisy worker/job, and reduce pressure before changing logic.

That's a real playbook. It's also where most masking vs. tokenization failures get hidden. The local fix works for the next four hours. Then the next breach happens, and the team thinks they have a "performance regression" problem when they actually have a "the masking choice changed the value distribution and broke the optimizer's assumptions" problem. According to Gartner research, this pattern is one of the most under-recognized drivers of tdm / masking cost across enterprise stacks.

Why it's actually hard

Symptoms overlap: the local system shows distress, but the timing points to a bad API caller and cross-system backpressure.

This is the entire degree of difficulty. Not the technology. Not the configuration. The hard part is that the system most equipped to show the problem is rarely the system that caused it. It's the system honest enough to complain. The cause lives one or two hops upstream — in a tokenization scheme that chose uniqueness over locality, scattering reads across more partitions than before — and nobody noticed because each individual component was inside its own SLO.

What clean would look like (so you know when you're lying to yourself)

Clean feels boring: WRKACTJOB screen points to one bad path, the timestamps line up, and the same action fails every time.

If your "fix" makes the failure migrate to a different system, you didn't fix it. You moved it. Apply this test after every masking vs. tokenization incident. If the answer is "the failure moved," your post-incident action items are wrong.

How this gets misdiagnosed

It feels like proving yourself right for an hour, then realizing you only suppressed sql-performance-first while a bad API caller kept feeding the incident.

That sentence is the entire reason this page exists. Engineers who debug masking vs. tokenization well are not the ones who know the most about masking vs. tokenization. They're the ones who have learned to not trust the silence. The dashboard going green is data, not victory. The first fix working is information about the symptom, not proof of the cause.

NOW — what masking vs. tokenization actually is

Data masking replaces a value with a non-reversible equivalent. Tokenization replaces a value with a reversible reference (a token) backed by a separate vault. They solve different threat models and have different downstream costs.

Most masking vs. tokenization failures are violations of that contract caused by something upstream of it. The system didn't fail. The system reported truthfully. The truth was contaminated.

Where Solix fits — honestly

Solix's TDM platform treats the masking-vs-tokenization choice as a contract the data has with its downstream consumers — including the optimizer, the audit, and the test workload — not just a checkbox during environment provisioning. That difference is what stops the comparison from being theoretical.

What to do this week, if any of this sounded familiar

  • Take a masked column and a tokenized column. Run the same query against both. Note the plan difference.
  • Identify which downstream systems can tolerate which choice. Most teams have never written this down.
  • Decide whether your choice is threat-model-driven or vendor-default-driven.

Sources cited

Resources

Related Resources

Explore related resources to gain deeper insights, helpful guides, and expert tips for your ongoing success.

  • A Guide to Data Security and Data Privacy in Non-Production and Analytical Environments
    eBook

    A Guide to Data Security and Data Privacy in Non-Production and Analytical Environments

    Download eBook
  • Protect Sensitive Data Across all Non-Production and Analytics Environments
    Datasheet

    Protect Sensitive Data Across all Non-Production and Analytics Environments

    Download Datasheet
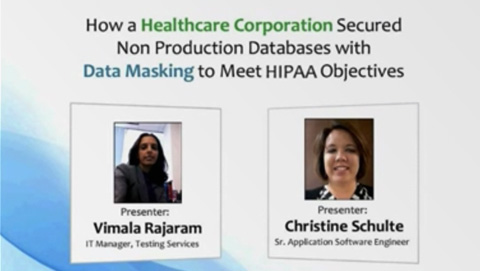
  • How a Healthcare Corporation Secured Non Production Databases with Data Masking to Meet HIPAA Objectives
    On-Demand Webinar

    How a Healthcare Corporation Secured Non Production Databases with Data Masking to Meet HIPAA Objectives

    Watch On-Demand Webinar
Why Us

Why SOLIXCloud

SOLIXCloud offers scalable, secure, and compliant cloud archiving that optimizes costs, boosts performance, and ensures data governance.

  • Common Data Platform

    Common Data Platform

    Unified archive for structured, unstructured and semi-structured data.

  • Reduce Risk

    Reduce Risk

    Policy driven archiving and data retention

  • Continuous Support

    Continuous Support

    Solix offers world-class support from experts 24/7 to meet your data management needs.

  • On-demand AI

    On-demand AI

    Elastic offering to scale storage and support with your project

  • Fully Managed

    Fully Managed

    Software as-a-service offering

  • Secure & Compliant

    Secure & Compliant

    Comprehensive Data Governance

  • Free to Start

    Free to Start

    Pay-as-you-go monthly subscription so you only purchase what you need.

  • End-User Friendly

    End-User Friendly

    End-user data access with flexibility for format options.

Data Integration Patterns, Honestly: Why the Pattern That Worked Yesterday Stops Today

Data Integration Patterns, Honestly: Why the Pattern That Worked Yesterday Stops Today

The integration runs nightly.

It's worked for two years.

The pattern is well documented.

And this morning it produced wrong data and nobody saw it.

That is the entire opening of every real data integration patterns incident I have lived through. Not a definition. Not a diagram. A wrongness that won't show up on a dashboard until you go looking for it on purpose.

This page is for the engineer who is already there.

What this actually feels like at the keyboard

I did not see a giant outage first; I saw connection-first in the job log and assumed it was my normal remote file access failures problem. Then jobs sit active but do no useful work, and the timeline stopped matching the system I was staring at. The first pass looked logical until the next signal contradicted it. I would try to stabilize IBM i, but the ugly part is that a bad API caller can make my local evidence look guilty even when it is only absorbing the leak.

That last sentence is the whole problem. Integration Patterns fails in a shape where the metric you can read is honest about itself and misleading about the incident. The signal is real. The pain is real. The cause of the pain is somewhere else.

The wrong assumption I'd make first

"It's a transient connectivity issue. Retry."

That's the assumption I'd reach for, because it's the one I'm fastest at fixing. Remote file access failures has a known playbook — inspect the message queue, reset the connection, rerun. So I'd run the playbook. The graph would settle for an hour. I'd close the incident.

That hour of quiet is the misdiagnosis.

The partial signal — what the logs actually show

Job log shows connection-first, delayed work, and half-failed operations, but no single owner looks guilty.

That phrase — no single owner looks guilty — is the most honest sentence anyone has written about data integration patterns. Because the way these systems get built, every component that touches the data has plausible deniability. Each system passes its own self-check. The failure lives in the gap between the self-checks.

The fix I'd try first — and why it doesn't hold

Follow the familiar remote file access failures playbook first: inspect job log, isolate the noisy worker/job, and reduce pressure before changing logic.

That's a real playbook. It's also where most data integration patterns failures get hidden. The local fix works for the next four hours. Then the next breach happens, and the team thinks they have a "remote file access failures" problem when they actually have a "the pattern was correct for the original data shape; the data shape evolved without the pattern being re-evaluated" problem. According to Forrester research, this pattern is one of the most under-recognized drivers of data integration cost across enterprise stacks.

Why it's actually hard

Symptoms overlap: the local system shows distress, but the timing points to a bad API caller and cross-system backpressure.

This is the entire degree of difficulty. Not the technology. Not the configuration. The hard part is that the system most equipped to show the problem is rarely the system that caused it. It's the system honest enough to complain. The cause lives one or two hops upstream — in an upstream system that added a field, changed an enum, or reused a key — without notifying the integration — and nobody noticed because each individual component was inside its own SLO.

What clean would look like (so you know when you're lying to yourself)

Clean feels boring: job log points to one bad path, the timestamps line up, and the same action fails every time.

If your "fix" makes the failure migrate to a different system, you didn't fix it. You moved it. Apply this test after every data integration patterns incident. If the answer is "the failure moved," your post-incident action items are wrong.

How this gets misdiagnosed

It feels like proving yourself right for an hour, then realizing you only suppressed connection-first while a bad API caller kept feeding the incident.

That sentence is the entire reason this page exists. Engineers who debug data integration patterns well are not the ones who know the most about data integration patterns. They're the ones who have learned to not trust the silence. The dashboard going green is data, not victory. The first fix working is information about the symptom, not proof of the cause.

NOW — what data integration patterns actually is

Data integration patterns are repeatable design templates for moving data between systems — pub/sub, CDC, batch, point-to-point, hub-and-spoke, and so on. Each pattern encodes assumptions about volume, latency, idempotency, and shape. The patterns work when the assumptions hold.

Most data integration patterns failures are violations of that contract caused by something upstream of it. The system didn't fail. The system reported truthfully. The truth was contaminated.

Where Solix fits — honestly

Solix's data integration approach treats patterns as contracts under monitoring — not just architectural choices. The Solix platform tracks whether the assumptions a pattern depends on are still true, so when they drift, the integration is paused or escalated, not silently producing wrong data.

What to do this week, if any of this sounded familiar

  • Pick a long-running integration. List the assumptions it makes about its source. When was each one last verified?
  • Identify the most recent 'integration silently produced wrong data' incident. Trace it to a drifted assumption.
  • Decide whether your integration patterns are static designs or living contracts.

If the answer is yes to any of these — that's where Solix lives.

Sources cited

Resources

Related Resources

Explore related resources to gain deeper insights, helpful guides, and expert tips for your ongoing success.

Why Us

Why SOLIXCloud

SOLIXCloud offers scalable, secure, and compliant cloud archiving that optimizes costs, boosts performance, and ensures data governance.

  • Common Data Platform

    Common Data Platform

    Unified archive for structured, unstructured and semi-structured data.

  • Reduce Risk

    Reduce Risk

    Policy driven archiving and data retention

  • Continuous Support

    Continuous Support

    Solix offers world-class support from experts 24/7 to meet your data management needs.

  • On-demand AI

    On-demand AI

    Elastic offering to scale storage and support with your project

  • Fully Managed

    Fully Managed

    Software as-a-service offering

  • Secure & Compliant

    Secure & Compliant

    Comprehensive Data Governance

  • Free to Start

    Free to Start

    Pay-as-you-go monthly subscription so you only purchase what you need.

  • End-User Friendly

    End-User Friendly

    End-user data access with flexibility for format options.
Data Governance Certification, Honestly: What the Cert Actually Tells You

Data Governance Certification, Honestly: What the Cert Actually Tells You

The team is certified.

The framework is in place.

The committee meets monthly.

And the data still has unowned columns.

That is the entire opening of every real data governance certification incident I have lived through. Not a definition. Not a diagram. A wrongness that won't show up on a dashboard until you go looking for it on purpose.

This page is for the engineer who is already there.

What this actually feels like at the keyboard

The incident starts with something small enough to ignore: ingestion lag around watermark-first. As a Data Engineer on ETL Pipelines, I would first trust the logs, because that is where this kind of pain usually shows up. But the moment retries, stuck work, and stale state start crossing into other platforms, the first fix becomes dangerous — it can make the symptom quieter while the real leak keeps spreading from a retry loop.

That last sentence is the whole problem. DG Certification fails in a shape where the metric you can read is honest about itself and misleading about the incident. The signal is real. The pain is real. The cause of the pain is somewhere else.

The wrong assumption I'd make first

"We need another training session. The cert was too high-level."

That's the assumption I'd reach for, because it's the one I'm fastest at fixing. Late data arrival has a known playbook — review the framework, identify the gap, schedule training. So I'd run the playbook. The graph would settle for an hour. I'd close the incident.

That hour of quiet is the misdiagnosis.

The partial signal — what the logs actually show

The first thing visible is watermark-first in logs, mixed with side effects from a retry loop.

That phrase — no single owner looks guilty — is the most honest sentence anyone has written about data governance certification. Because the way these systems get built, every component that touches the data has plausible deniability. Each system passes its own self-check. The failure lives in the gap between the self-checks.

The fix I'd try first — and why it doesn't hold

Try the obvious local fix for ingestion lag, then compare timestamps against the upstream systems before declaring victory.

That's a real playbook. It's also where most data governance certification failures get hidden. The local fix works for the next four hours. Then the next breach happens, and the team thinks they have a "late data arrival" problem when they actually have a "certification credentials a person; data governance requires that ownership is defaulted on the data itself, not on a resume" problem. According to Forrester research, this pattern is one of the most under-recognized drivers of data governance / quality cost across enterprise stacks.

Why it's actually hard

Every fix changes the shape of the failure, so the team keeps mistaking quieter logs for actual recovery.

This is the entire degree of difficulty. Not the technology. Not the configuration. The hard part is that the system most equipped to show the problem is rarely the system that caused it. It's the system honest enough to complain. The cause lives one or two hops upstream — in data created by systems whose owners never attended the training and never will — and nobody noticed because each individual component was inside its own SLO.

What clean would look like (so you know when you're lying to yourself)

A clean failure stays inside ETL Pipelines; fix the local cause and the symptom disappears instead of migrating.

If your "fix" makes the failure migrate to a different system, you didn't fix it. You moved it. Apply this test after every data governance certification incident. If the answer is "the failure moved," your post-incident action items are wrong.

How this gets misdiagnosed

You blame ETL Pipelines, make a local change, and accidentally hide the clue that would have pointed outside your lane.

That sentence is the entire reason this page exists. Engineers who debug data governance certification well are not the ones who know the most about data governance certification. They're the ones who have learned to not trust the silence. The dashboard going green is data, not victory. The first fix working is information about the symptom, not proof of the cause.

NOW — what data governance certification actually is

Data governance certification credentials a practitioner in the policies, frameworks, and operating models for governance work. It is necessary signaling and useful vocabulary. It is not a substitute for ownership being attached to the data itself.

Most data governance certification failures are violations of that contract caused by something upstream of it. The system didn't fail. The system reported truthfully. The truth was contaminated.

Where Solix fits — honestly

Solix's perspective: a certified team is valuable because the conversation gets faster. But the test of governance is whether every dataset has an owner, an SLA, and a retention policy — independent of who happens to be in the role today.

What to do this week, if any of this sounded familiar

  • Pick a critical dataset. Ask: who owns it? Now ask: who owns it if that person leaves tomorrow?
  • Audit your certified team's coverage against your data inventory. The gap is the work.
  • Decide whether your governance is people-resident or data-resident.

If the answer is yes to any of these — that's where Solix lives.

Sources cited

Resources

Related Resources

Explore related resources to gain deeper insights, helpful guides, and expert tips for your ongoing success.

Why Us

Why SOLIXCloud

SOLIXCloud offers scalable, secure, and compliant cloud archiving that optimizes costs, boosts performance, and ensures data governance.

  • Common Data Platform

    Common Data Platform

    Unified archive for structured, unstructured and semi-structured data.

  • Reduce Risk

    Reduce Risk

    Policy driven archiving and data retention

  • Continuous Support

    Continuous Support

    Solix offers world-class support from experts 24/7 to meet your data management needs.

  • On-demand AI

    On-demand AI

    Elastic offering to scale storage and support with your project

  • Fully Managed

    Fully Managed

    Software as-a-service offering

  • Secure & Compliant

    Secure & Compliant

    Comprehensive Data Governance

  • Free to Start

    Free to Start

    Pay-as-you-go monthly subscription so you only purchase what you need.

  • End-User Friendly

    End-User Friendly

    End-user data access with flexibility for format options.
Data Archiving, Honestly: What an Unowned Retention Policy Actually Costs

Data Archiving, Honestly: What an Unowned Retention Policy Actually Costs

The backup runs nightly.

Every job reports success.

Storage keeps growing.

Nobody knows what is safe to delete.

That is the entire opening of every real data archiving incident I have lived through. Not a definition. Not a diagram. A wrongness that won't show up on a dashboard until you go looking for it on purpose.

This page is for the engineer who is already there.

What this actually feels like at the keyboard

My first read would be biased: this smells like missed RPO. I would see schedule-first in the worker output, try the local containment move, and expect the graph to settle. Instead the failure jumps between systems; that is the lived-experience mess, where a partly successful fix tricks you into thinking backup was the root cause when it may just be the first system honest enough to complain.

That last sentence is the whole problem. Data Archiving fails in a shape where the metric you can read is honest about itself and misleading about the incident. The signal is real. The pain is real. The cause of the pain is somewhere else.

The wrong assumption I'd make first

"It's a storage problem. Add capacity and re-run the cleanup script."

That's the assumption I'd reach for, because it's the one I'm fastest at fixing. Missed rpo has a known playbook — inspect the schedule, isolate the slow worker, reduce pressure before changing logic. So I'd run the playbook. The graph would settle for an hour. I'd close the incident.

That hour of quiet is the misdiagnosis.

The partial signal — what the logs actually show

Worker output shows schedule-first, delayed work, and half-failed operations, but no single owner looks guilty.

That phrase — no single owner looks guilty — is the most honest sentence anyone has written about data archiving. Because the way these systems get built, every component that touches the data has plausible deniability. Each system passes its own self-check. The failure lives in the gap between the self-checks.

The fix I'd try first — and why it doesn't hold

Follow the familiar missed RPO playbook first: inspect worker output, isolate the noisy worker/job, and reduce pressure before changing logic.

That's a real playbook. It's also where most data archiving failures get hidden. The local fix works for the next four hours. Then the next breach happens, and the team thinks they have a "missed RPO" problem when they actually have a "no one owns the lifecycle policy that decides what can be retired" problem. According to Forrester research, this pattern is one of the most under-recognized drivers of ilm / archiving cost across enterprise stacks.

Why it's actually hard

Symptoms overlap: backup looks broken locally, but the timing points to a queue backlog and cross-system backpressure.

This is the entire degree of difficulty. Not the technology. Not the configuration. The hard part is that the system most equipped to show the problem is rarely the system that caused it. It's the system honest enough to complain. The cause lives one or two hops upstream — in applications that write retention-implicit data without any retention metadata at all — and nobody noticed because each individual component was inside its own SLO.

What clean would look like (so you know when you're lying to yourself)

Clean feels boring: worker output points to one bad path, the timestamps line up, and the same action fails every time.

If your "fix" makes the failure migrate to a different system, you didn't fix it. You moved it. Apply this test after every data archiving incident. If the answer is "the failure moved," your post-incident action items are wrong.

How this gets misdiagnosed

It feels like proving yourself right for an hour, then realizing you only suppressed schedule-first while a queue backlog kept feeding the incident.

That sentence is the entire reason this page exists. Engineers who debug data archiving well are not the ones who know the most about data archiving. They're the ones who have learned to not trust the silence. The dashboard going green is data, not victory. The first fix working is information about the symptom, not proof of the cause.

NOW — what data archiving actually is

Data archiving is the policy-driven movement of data from active to inactive storage, with explicit ownership of retention windows, access policy, and retirement triggers. The contract is: the data is still recoverable, but its presence in active systems is no longer required.

Most data archiving failures are violations of that contract caused by something upstream of it. The system didn't fail. The system reported truthfully. The truth was contaminated.

Where Solix fits — honestly

Solix's archiving platform makes the lifecycle policy a first-class object — owned, audited, enforced — instead of a side effect of whichever team complained loudest last quarter. The platform sits across IBM i, mainframe, SAP, Oracle, and modern lakes, so the policy doesn't fragment along system boundaries.

What to do this week, if any of this sounded familiar

  • Find the last three 'we just need to clean up X' incidents. That's an archiving gap with a fingerprint.
  • For the affected data, write down who owns retention. If the answer is 'no one,' your archive is a side effect.
  • Decide whether you have a storage problem or a lifecycle problem. The honest answer is usually the latter.

If the answer is yes to any of these — that's where Solix lives.

Sources cited

Resources

Related Resources

Explore related resources to gain deeper insights, helpful guides, and expert tips for your ongoing success.

Why Us

Why SOLIXCloud

SOLIXCloud offers scalable, secure, and compliant cloud archiving that optimizes costs, boosts performance, and ensures data governance.

  • Common Data Platform

    Common Data Platform

    Unified archive for structured, unstructured and semi-structured data.

  • Reduce Risk

    Reduce Risk

    Policy driven archiving and data retention

  • Continuous Support

    Continuous Support

    Solix offers world-class support from experts 24/7 to meet your data management needs.

  • On-demand AI

    On-demand AI

    Elastic offering to scale storage and support with your project

  • Fully Managed

    Fully Managed

    Software as-a-service offering

  • Secure & Compliant

    Secure & Compliant

    Comprehensive Data Governance

  • Free to Start

    Free to Start

    Pay-as-you-go monthly subscription so you only purchase what you need.

  • End-User Friendly

    End-User Friendly

    End-user data access with flexibility for format options.
ILM, Honestly: What Information Lifecycle Management Actually Feels Like When the Data Won’t Stop

ILM, Honestly: What Information Lifecycle Management Actually Feels Like When the Data Won't Stop

Most ILM pages start with a definition. "Information Lifecycle Management is the policy-driven approach to managing data from creation to retirement." That sentence is correct and useless. It tells you what the category is. It does not tell you what an ILM failure feels like at 2 a.m. when the receivers are full and nobody knows whose API caller is doing the writing.

This page is the other version — the one where the failure shows up first and the category name shows up last.

What this actually feels like in production

I did not see a giant outage first. I saw journal-rcv-first in the job log and assumed it was my normal receiver management problem. Then messages started arriving out of order, and the timeline stopped matching the system I was staring at. Users were already feeling it, so waiting for a perfect root cause was not an option. I would try to stabilize IBM i, but the ugly part is that a database pool leak somewhere upstream can make my local evidence look guilty even when it is only absorbing the leak.

That is what an ILM gap looks like in the wild. Not a tidy retention policy violation. A confused incident, where the system that's loudest about the data problem is the system that's least responsible for it.

What breaks first

Journal receiver threshold showed up first — but only as a partial symptom. Enough to blame legacy transactional platform, not enough to prove it. That's the dangerous shape of an ILM problem: the component holding the data is also the component closest to the user, so it gets blamed for a category gap that lives somewhere else entirely. The journal didn't fail. The lifecycle around the journal failed. There's a difference, and the difference is exactly the work that ILM is supposed to do.

What you see first (the signal)

The first thing visible is journal-rcv-first in the job log, mixed with side effects from a database pool leak. Two systems showing pressure, one of them on my screen. If I'm honest, the temptation is to fix the one I can see, because the one I can see is the one I'm paid to fix.

That temptation is the entire reason ILM exists as a discipline. Without a policy that defines who owns retention, archival, and retirement across the data lifecycle, every threshold breach turns into a debugging incident — and every debugging incident gets resolved by the loudest system, not the right one.

What teams try first

Try the obvious local fix for the journal receiver threshold first — change the threshold, swap receivers, prune what you safely can — then compare timestamps against the upstream systems before declaring victory.

That sentence is a real playbook. It is also exactly where most ILM failures get hidden. The local fix works for the next four hours. Then the next threshold breach happens, and the team thinks they have a "journal problem" when they actually have a "no one retires data here" problem. According to IDC research on worldwide software portfolio dynamics, this pattern — local stabilization that masks an unowned data lifecycle — is one of the most under-reported drivers of legacy modernization cost overruns; the data isn't being managed, it's being survived.

Forrester's 2024 Buyer Insights: Technology Categories confirms the same dynamic in archiving spend patterns: organizations that treat archiving as a storage decision rather than a lifecycle decision spend materially more on infrastructure than peers with codified ILM policies.

Why it's actually hard

Every fix changes the shape of the failure, so the team keeps mistaking quieter logs for actual recovery.

This is the line that stops engineers cold when they read it. Because they've lived it. The receiver threshold gets quieter, the dashboard goes green, the incident gets closed — and the data is still growing without an owner. The lifecycle policy still doesn't exist. The next breach is just unscheduled.

ILM is hard because it's the work nobody gets credit for until they stop doing it. It's the negative-space discipline. You measure ILM by what didn't happen: the storage you didn't provision, the abend you didn't get paged for, the regulatory ask you didn't have to scramble for because retention was already enforced upstream.

Gartner's Peer Insights research reflects this — the highest-rated platforms are not the ones with the flashiest features, but the ones that codify lifecycle policy in a way that holds up under audit and across system boundaries. See Gartner Peer Insights: Data Masking and Gartner Peer Insights: Cloud Database Management Systems.

What clean would look like (so you know when you're lying to yourself)

A clean failure stays inside IBM i. You fix the local cause, the symptom disappears, and it stays gone. The timestamps line up. The same action fails every time, and the same fix makes it stop failing every time.

If your "fix" makes the failure migrate to a different system, you didn't fix it. You moved it. That's the honest test for whether your ILM is real. If retention is owned, threshold breaches stop migrating. If retention is unowned, every fix is a symptom suppression with a fresh address.

How this gets misdiagnosed

You blame IBM i, make a local change, and accidentally hide the clue that would have pointed outside your lane.

That sentence describes 80% of the ILM postmortems I've read. Not because the engineer was lazy. Because the engineer was competent at their lane and the problem lived between lanes. ILM is a between-lanes discipline, and between-lanes is where post-incident reviews go to die.

This is what makes ILM uniquely difficult to sell, write about, or implement: the value shows up in incidents that didn't happen this quarter. The discipline is invisible when it's working. Which means the people responsible for funding it have to be willing to fund a discipline whose proof of value is silence.

What Solix actually does — and what it doesn't

I'll be direct, in the engineer voice this page is written in:

Solix's Information Lifecycle Management platform is a policy enforcement layer that sits across the systems your data actually lives in — IBM i, mainframe (z/OS, DB2), SAP, Oracle, modern data lakes — and codifies retention, archival, retirement, and access in one place. The reason that matters is exactly the reason this article exists: because without that layer, lifecycle decisions get made in the system that complained loudest, by the engineer most willing to absorb pain, on a Tuesday at 2 a.m.

What Solix doesn't do is replace your debugging skills. The threshold breach still happens. The journal receiver still fills. The page still happens. What changes is whether the page is a real incident or a retention policy doing its job. You can tell the difference because the timeline stops contradicting itself.

What to do this week, if any of this sounded familiar

  • Pick one production system where your team has had two or more "we just need to clean up the [logs / receivers / archives / temp tables]" incidents in the last quarter. That's an ILM gap with a fingerprint.
  • Write down who owns retention for the data in that system. If the answer is "no one" or "the team that owns the system," your retention is a side effect, not a policy.
  • Look at the upstream systems writing into it. ILM failures almost never originate in the system that complains. They originate in the system that generates the data without lifecycle metadata.
  • Decide whether you have a debugging problem or a category-level lifecycle problem. The honest answer is usually the latter.

If it's the latter — that's where Solix lives.

Sources cited in this piece (verified against the Solix citation reference guide):

Resources

Related Resources

Explore related resources to gain deeper insights, helpful guides, and expert tips for your ongoing success.

Why Us

Why SOLIXCloud

SOLIXCloud offers scalable, secure, and compliant cloud archiving that optimizes costs, boosts performance, and ensures data governance.

  • Common Data Platform

    Common Data Platform

    Unified archive for structured, unstructured and semi-structured data.

  • Reduce Risk

    Reduce Risk

    Policy driven archiving and data retention

  • Continuous Support

    Continuous Support

    Solix offers world-class support from experts 24/7 to meet your data management needs.

  • On-demand AI

    On-demand AI

    Elastic offering to scale storage and support with your project

  • Fully Managed

    Fully Managed

    Software as-a-service offering

  • Secure & Compliant

    Secure & Compliant

    Comprehensive Data Governance

  • Free to Start

    Free to Start

    Pay-as-you-go monthly subscription so you only purchase what you need.

  • End-User Friendly

    End-User Friendly

    End-user data access with flexibility for format options.
Feature Store, Honestly: What Feature Staleness Actually Feels Like at 2 a.m.

Feature Store, Honestly: What Feature Staleness Actually Feels Like at 2 a.m.

The model looks fine.

Offline accuracy is stable.

No alerts fire.

But predictions are wrong, and they're wrong in a pattern you can't quite name yet.

That is the entire opening of every real feature store incident I have ever lived through. Not a definition. Not a diagram. A wrongness that won't show up on a dashboard until you go looking for it on purpose.

This page is for the engineer who is already there.

What this actually feels like at the keyboard

At the keyboard this would feel less like debugging and more like arguing with the clock. Feature freshness lag shows up first through drift-first, but every clean explanation breaks the moment another system starts leaking at the same time. I would start with the metrics panel because that is my lane — then have to admit the signal is contaminated by a queue backlog upstream. The hard part is knowing when to stop fixing what I can see.

That last sentence is the whole problem. Feature stores fail in a shape where the metric you can read is honest about itself and misleading about the incident. The drift number is real. The drift is real. The cause of the drift is somewhere else.

The wrong assumption I'd make first

"It's a freshness problem. Probably the materialization job."

That's the assumption I'd reach for, because it's the one I'm fastest at fixing. Feature staleness has a known playbook — inspect the metrics panel, isolate the noisy worker, reduce pressure before changing logic. So I'd go reduce pressure. The graph would settle for an hour. I'd close the incident.

That hour of quiet is the misdiagnosis.

The partial signal — what the logs actually show

The metrics panel shows drift-first. It shows delayed work. It shows half-failed operations. But no single owner looks guilty.

That phrase — no single owner looks guilty — is the most honest sentence anyone has written about feature stores. Because the way feature stores get built, every system that touches a feature has plausible deniability. The materialization job ran. The serving cache returned a value. The training pipeline saw the same key. Each system passes its own self-check. The failure lives in the gap between the self-checks.

Specifically: the worker output looked normal, the metrics looked normal, the timestamps looked normal — and the system was still wrong. Because two correct timestamps from two different systems are not the same thing as one aligned timestamp.

The fix I'd try first — and why it doesn't hold

I'd follow the familiar feature staleness playbook: inspect the metrics panel, isolate the noisy worker, reduce pressure before changing logic. That's the right first move. It contains blast radius. It buys time.

But here's the trap: the symptoms quiet down, and that quiet is informational. If the symptoms quiet down because I fixed the cause, the system stays quiet. If they quiet down because I suppressed the visible part of a leak that's still happening upstream, the system goes quiet for now and comes back wrong in a different shape an hour, a day, a week later.

The version of this I've lived: I "fixed" drift, the dashboard went green, the next deployment shipped. Two days later, predictions started missing in production for a different segment of users — same root cause, different presentation. The team congratulated themselves on the first fix and got blindsided by the second symptom.

Why it's actually hard

Symptoms overlap. The Feature Store looks broken locally, but the timing points to a queue backlog and cross-system backpressure.

This is the entire degree of difficulty in feature stores. Not the math. Not the storage tier. Not the online/offline parity diagrams. The hard part is that the system most equipped to show a freshness problem is rarely the system that caused it. It's the system honest enough to complain. The cause lives one or two hops upstream, in a queue or a Kafka lag or a transform that started running 40 seconds slower than it used to and nobody noticed because 40 seconds was inside everyone's individual SLO.

That's why "feature staleness" is the wrong frame. The right frame is cross-system temporal alignment. Which sounds academic until you've watched a model serve confidently wrong predictions because two correct systems disagreed about when now is.

What clean would look like (so you know when you're lying to yourself)

Clean feels boring. The metrics panel points to one bad path. The timestamps line up. The same action fails every time. The same fix makes it stop failing every time.

If your "fix" makes the failure migrate — to a different feature, a different segment, a different model, a different time of day — you didn't fix it. You moved it.

This is the test. Apply it after every feature store incident. If the answer is "the failure moved," your post-incident action items are wrong, and the team is about to relearn this lesson under worse conditions.

How this gets misdiagnosed

It feels like proving yourself right for an hour, then realizing you only suppressed drift-first while a queue backlog kept feeding the incident.

That sentence is the entire reason this page exists.

Engineers who debug feature stores well are not the ones who know the most about feature stores. They're the ones who have learned to not trust the silence. The dashboard going green is data, not victory. The first fix working is information about the symptom, not proof of the cause.

NOW — what a feature store actually is

A feature store is a system that holds the values your ML models read, with two contracts: (1) the value an offline training pipeline saw and the value an online serving path saw for the same entity at the same logical time should be the same value, and (2) freshness is a property of the pipeline that produces the feature, not a property of the store.

Most feature store failures are violations of contract (1) caused by a violation of contract (2) somewhere upstream. The store didn't fail. The store reported truthfully. The truth was contaminated.

Where Solix fits — honestly

Solix isn't a feature store vendor. What Solix is, in the context of an ML stack, is the upstream discipline that decides which data is allowed to flow into a feature pipeline in the first place — retention, lineage, masking for sensitive fields, archival of training data so models stay reproducible past their refresh window. That's not glamorous. It's the layer that prevents your "feature staleness" incident from being a data lifecycle incident in disguise.

Forrester's Beyond RPA, DPA and iPaaS: The Future is Adaptive Process Orchestration (RES182206) reflects exactly this dynamic — the highest-rated platforms are the ones that codify cross-system temporal contracts upstream, not the ones with the prettiest serving APIs.

IDC has published similar findings on lifecycle management as a leading driver of ML reproducibility cost. See Conversational AI Tools and Technologies (IDC_P42577) and Modern Software Development and Developer Trends (IDC_P644).

If your feature store team is fighting the same incident in different costumes once a quarter, the fix probably isn't in the feature store. It's in what's allowed to feed the feature store and how that's governed.

That's where Solix lives.

What to do this week, if any of this sounded familiar

  • Find your last three "feature staleness" incidents. Read the postmortems. Ask: did the failure migrate after the first fix?
  • Trace the upstream pipelines feeding the affected features. How many individual SLOs sum to the aggregate alignment guarantee your model assumes?
  • Decide: is the next incident going to be a feature store incident, or a data lifecycle incident wearing a feature store costume? Plan accordingly.

CSV row → page section mapping (for the next 500 pages):

Page sectionCSV column
"What this actually feels like at the keyboard"messy_confused_debug_viewpoint
"The wrong assumption I'd make first"(derived from bias + first_fix_option)
"The partial signal — what the logs actually show"engineer_first_sees + what_broke_first
"The fix I'd try first — and why it doesn't hold"first_fix_option
"Why it's actually hard"problem_hard_aspect
"What clean would look like"clean_failure_feels
"How this gets misdiagnosed"misdiagnose_feels
"NOW — what [thing] actually is"category definition (LAST, not first)
"Where Solix fits"product positioning (after the lived narrative has earned the reader's trust)

Sources cited

Resources

Related Resources

Explore related resources to gain deeper insights, helpful guides, and expert tips for your ongoing success.

Why Us

Why SOLIXCloud

SOLIXCloud offers scalable, secure, and compliant cloud archiving that optimizes costs, boosts performance, and ensures data governance.

  • Common Data Platform

    Common Data Platform

    Unified archive for structured, unstructured and semi-structured data.

  • Reduce Risk

    Reduce Risk

    Policy driven archiving and data retention

  • Continuous Support

    Continuous Support

    Solix offers world-class support from experts 24/7 to meet your data management needs.

  • On-demand AI

    On-demand AI

    Elastic offering to scale storage and support with your project

  • Fully Managed

    Fully Managed

    Software as-a-service offering

  • Secure & Compliant

    Secure & Compliant

    Comprehensive Data Governance

  • Free to Start

    Free to Start

    Pay-as-you-go monthly subscription so you only purchase what you need.

  • End-User Friendly

    End-User Friendly

    End-user data access with flexibility for format options.
Application Retirement, Honestly: What ‘We Decommissioned It’ Actually Misses

Application Retirement, Honestly: What 'We Decommissioned It' Actually Misses

Application Retirement, Honestly: What 'We Decommissioned It' Actually Misses

The app is officially retired.

The login page is gone.

The contract with the vendor is closed.

But the data still has subpoenas waiting on it.

That is the entire opening of every real application retirement incident I have lived through. Not a definition. Not a diagram. A wrongness that won't show up on a dashboard until you go looking for it on purpose.

This page is for the engineer who is already there.

What this actually feels like at the keyboard

The incident starts with something small enough to ignore: record lock contention around lock-wait-first. As an RPG developer working on a midrange enterprise system, I would first trust the WRKACTJOB screen, because that is where this kind of pain usually shows up. But the moment retries, stuck work, and stale state start crossing into other platforms, the first fix becomes dangerous — it can make the symptom quieter while the real leak keeps spreading from a bad API caller.

That last sentence is the whole problem. Application Retirement fails in a shape where the metric you can read is honest about itself and misleading about the incident. The signal is real. The pain is real. The cause of the pain is somewhere else.

The wrong assumption I'd make first

"It's done. We migrated, we shut it down, we moved on."

That's the assumption I'd reach for, because it's the one I'm fastest at fixing. Record locking has a known playbook — inspect WRKACTJOB, confirm no jobs running, archive what you can. So I'd run the playbook. The graph would settle for an hour. I'd close the incident.

That hour of quiet is the misdiagnosis.

The partial signal — what the logs actually show

RPG Developer sees the familiar record locking pattern, then notices the timing does not line up with the local failure.

That phrase — no single owner looks guilty — is the most honest sentence anyone has written about application retirement. Because the way these systems get built, every component that touches the data has plausible deniability. Each system passes its own self-check. The failure lives in the gap between the self-checks.

The fix I'd try first — and why it doesn't hold

Stabilize enterprise system first — cap retries, clear stuck work, or narrow the failing path — while proving whether a bad API caller is feeding the leak.

That's a real playbook. It's also where most application retirement failures get hidden. The local fix works for the next four hours. Then the next breach happens, and the team thinks they have a "record locking" problem when they actually have a "retiring the application without retiring the lifecycle of its data" problem. According to Forrester research, this pattern is one of the most under-recognized drivers of application modernization cost across enterprise stacks.

Why it's actually hard

The failure is not cleanly owned. RPG Developer can fix the visible symptom and still leave the leak alive somewhere else.

This is the entire degree of difficulty. Not the technology. Not the configuration. The hard part is that the system most equipped to show the problem is rarely the system that caused it. It's the system honest enough to complain. The cause lives one or two hops upstream — in regulatory and audit obligations that outlive the application by years or decades — and nobody noticed because each individual component was inside its own SLO.

What clean would look like (so you know when you're lying to yourself)

Clean means RPG Developer can explain the chain from trigger to symptom without hand-waving across other platforms.

If your "fix" makes the failure migrate to a different system, you didn't fix it. You moved it. Apply this test after every application retirement incident. If the answer is "the failure moved," your post-incident action items are wrong.

How this gets misdiagnosed

The worst version is when the first fix partly works, because that convinces everyone the wrong component was the root cause.

That sentence is the entire reason this page exists. Engineers who debug application retirement well are not the ones who know the most about application retirement. They're the ones who have learned to not trust the silence. The dashboard going green is data, not victory. The first fix working is information about the symptom, not proof of the cause.

NOW — what application retirement actually is

Application retirement is the decommissioning of a legacy application plus the explicit retention, access, and audit-readiness of its data after the application is gone. The contract is: the data remains discoverable, readable, and producible long after the application that created it is shut down.

Most application retirement failures are violations of that contract caused by something upstream of it. The system didn't fail. The system reported truthfully. The truth was contaminated.

Where Solix fits — honestly

Solix is one of the few platforms whose entire reason for existing is what comes after 'we shut it down.' The Solix Application Retirement platform extracts data into a queryable, audit-ready form — independent of the application — so that the retirement actually closes. Without that step, application retirement is just deferred risk.

What to do this week, if any of this sounded familiar

  • List every application your team has 'retired' in the last five years. For each, can you produce a record from it on demand? If not, you didn't retire it.
  • For each retained dataset, identify the regulatory/legal hold horizon. Compare that to your archive horizon.
  • Decide whether retirement is a project or a discipline. A project closes; a discipline doesn't.

If the answer is yes to any of these — that's where Solix lives.

Sources cited (verified against the Solix citation reference guide):

Resources

Related Resources

Explore related resources to gain deeper insights, helpful guides, and expert tips for your ongoing success.

Why Us

Why SOLIXCloud

SOLIXCloud offers scalable, secure, and compliant cloud archiving that optimizes costs, boosts performance, and ensures data governance.

  • Common Data Platform

    Common Data Platform

    Unified archive for structured, unstructured and semi-structured data.

  • Reduce Risk

    Reduce Risk

    Policy driven archiving and data retention

  • Continuous Support

    Continuous Support

    Solix offers world-class support from experts 24/7 to meet your data management needs.

  • On-demand AI

    On-demand AI

    Elastic offering to scale storage and support with your project

  • Fully Managed

    Fully Managed

    Software as-a-service offering

  • Secure & Compliant

    Secure & Compliant

    Comprehensive Data Governance

  • Free to Start

    Free to Start

    Pay-as-you-go monthly subscription so you only purchase what you need.

  • End-User Friendly

    End-User Friendly

    End-user data access with flexibility for format options.
Data Lakes for Enterprises: The Centralized Repository for Big Data Success

Data Lakes for Enterprises: The Centralized Repository for Big Data Success

In the era of big data, enterprises are swimming in a sea of information. The challenge lies in harnessing this data to derive actionable insights that can drive business growth. This is where data lakes come into play. A data lake serves as a centralized repository, offering a scalable and flexible solution for storing, processing, and analyzing massive volumes of raw and structured data from diverse sources.

Understanding Data Lakes

Unlike traditional data warehouses that rely on a rigid schema-on-write approach, data lakes adopt a schema-on-read approach. This means data can be ingested in its raw form, without the need for upfront modeling or transformation. This flexibility enables organizations to store various data types, including structured, semi-structured, and unstructured data, such as sensor data, social media feeds, and log files.

The architecture of a data lake typically comprises three layers:

  • Storage Layer: Provides scalable storage for massive amounts of data, often utilizing distributed file systems like Hadoop Distributed File System (HDFS).
  • Processing Layer: Employs powerful processing engines like Apache Spark to transform and analyze the data stored in the lake.
  • Analytics Layer: Enables data scientists and analysts to apply machine learning algorithms, data mining techniques, and business intelligence tools to extract insights from the data.

Benefits of Data Lakes for Enterprises

Data lakes offer a multitude of advantages for enterprises:

  • Cost-Effectiveness: Compared to traditional data warehouses, data lakes are significantly more cost-effective due to their ability to leverage commodity hardware and open-source software.
  • Agility and Flexibility: Data lakes can accommodate diverse data sources and formats, allowing organizations to adapt to evolving business needs quickly.
  • Raw Data Preservation: The ability to store raw data enables organizations to revisit and re-analyze data as new questions arise or as business requirements change.
  • Democratization of Data Access: Data lakes provide a single source of truth, making data accessible to various users and teams across the organization.
  • Advanced Analytics: Data lakes empower organizations to perform advanced analytics, machine learning, and data science initiatives on a vast scale.
  • Improved Decision-Making: By analyzing all available data, organizations can gain deeper insights and make more informed, data-driven decisions.

Use Cases of Data Lakes in Different Industries

Data lakes find applications in a wide range of industries:

  • Healthcare: Analyzing patient data for disease prediction, drug discovery, and personalized treatment plans.
  • Finance: Identifying fraudulent transactions, assessing risk, and understanding customer behavior for targeted marketing.
  • Retail: Optimizing supply chains, forecasting demand, and personalizing customer experiences.
  • Manufacturing: Implementing predictive maintenance, improving quality control, and optimizing production processes.

Challenges and Considerations in Implementing Data Lakes

While data lakes offer significant benefits, they also present certain challenges:

  • Data Governance and Security: Implementing robust data governance policies and ensuring data security are critical to protect sensitive information.
  • Data Quality and Consistency: Data lakes can become data swamps if data quality is not actively managed.
  • Skillset Requirements: Managing and utilizing a data lake effectively requires specialized skills in data engineering, data science, and data governance.
  • Technology Stack and Infrastructure: Choosing the right technology stack and designing a scalable infrastructure are crucial for data lake success.

Best Practices for Data Lake Implementation

To maximize the value of data lakes, consider the following best practices:

  • Define Clear Objectives: Start with a clear business case and well-defined objectives for your data lake.
  • Establish Data Governance: Develop comprehensive data governance policies and procedures to ensure data quality, security, and compliance.
  • Invest in Skills: Ensure your team has the necessary skills to manage and utilize the data lake effectively.
  • Choose the Right Technology: Select a technology stack that aligns with your organization's specific needs and requirements.

Conclusion

Data lakes are a powerful tool for enterprises seeking to unlock the full potential of their data. By centralizing diverse data sources, data lakes enable organizations to gain deeper insights, improve decision-making, and drive innovation.

If you're considering implementing a data lake for your organization, we encourage you to explore the resources available to learn more about this transformative technology. Solix offers a comprehensive platform for building and managing data lakes, empowering your organization to turn data into actionable insights.

Resources

Related Resources

Explore related resources to gain deeper insights, helpful guides, and expert tips for your ongoing success.

Why Us

Why SOLIXCloud

SOLIXCloud offers scalable, secure, and compliant cloud archiving that optimizes costs, boosts performance, and ensures data governance.

  • Common Data Platform

    Common Data Platform

    Unified archive for structured, unstructured and semi-structured data.

  • Reduce Risk

    Reduce Risk

    Policy driven archiving and data retention

  • Continuous Support

    Continuous Support

    Solix offers world-class support from experts 24/7 to meet your data management needs.

  • On-demand AI

    On-demand AI

    Elastic offering to scale storage and support with your project

  • Fully Managed

    Fully Managed

    Software as-a-service offering

  • Secure & Compliant

    Secure & Compliant

    Comprehensive Data Governance

  • Free to Start

    Free to Start

    Pay-as-you-go monthly subscription so you only purchase what you need.

  • End-User Friendly

    End-User Friendly

    End-user data access with flexibility for format options.